Projects / Master's coursework
Python fundamentals
A toolkit for market data
Summary
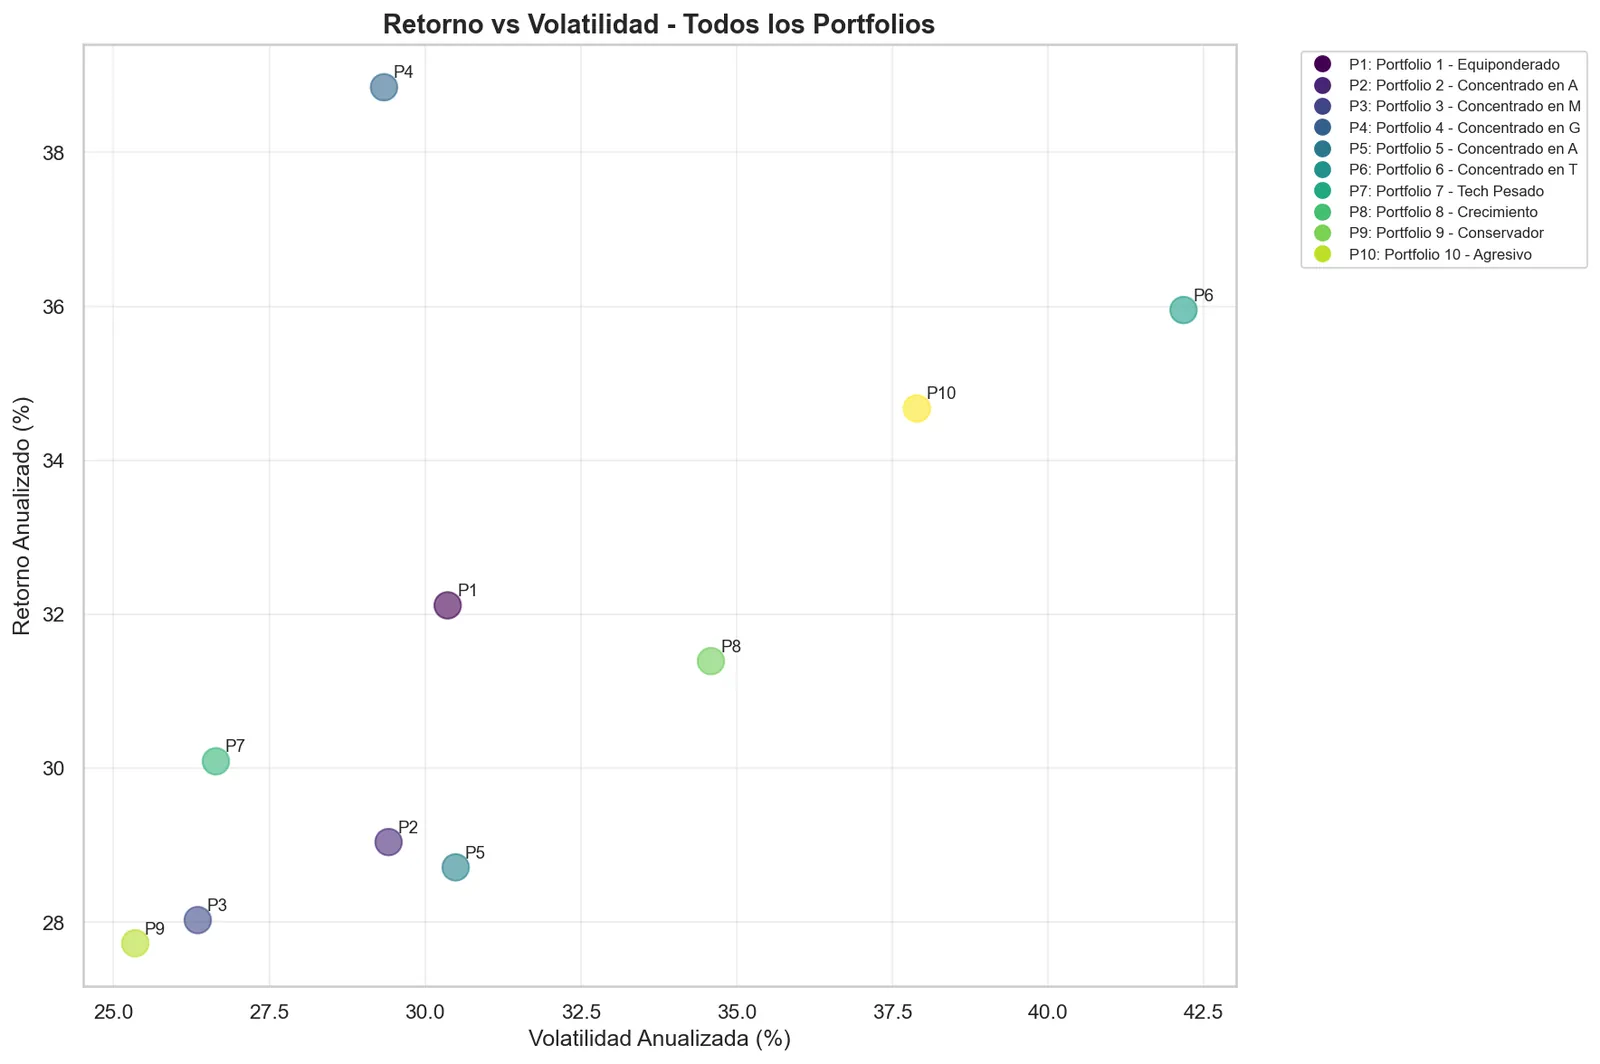
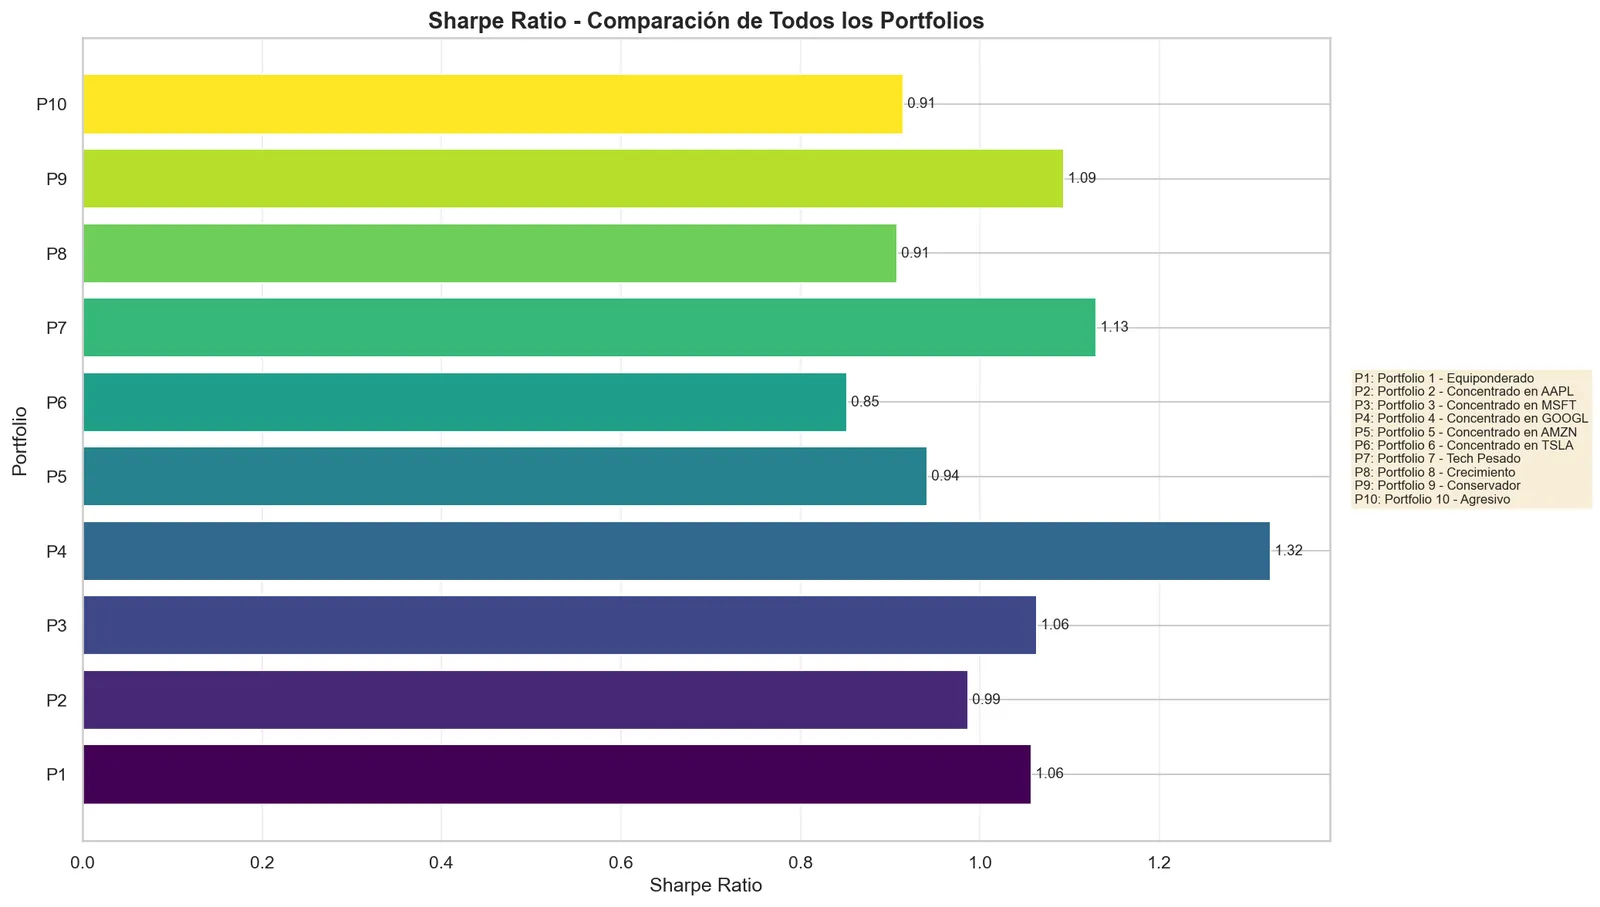
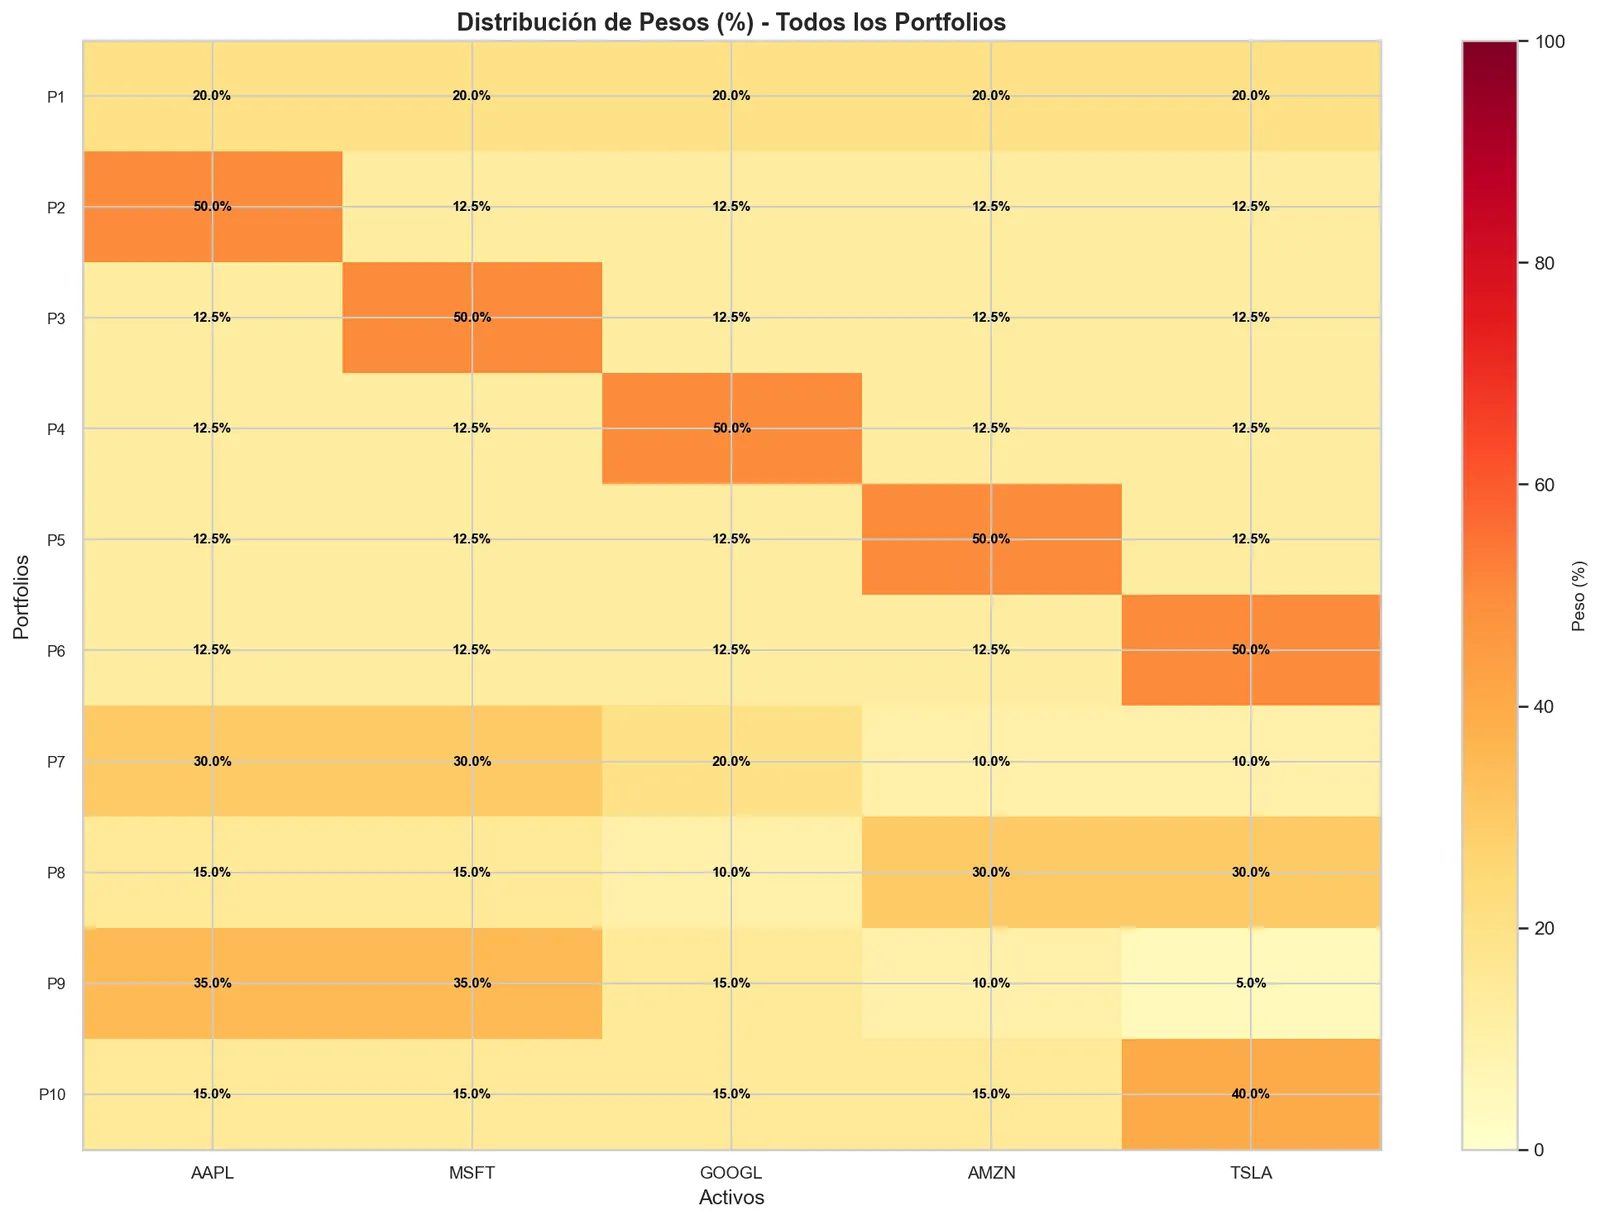
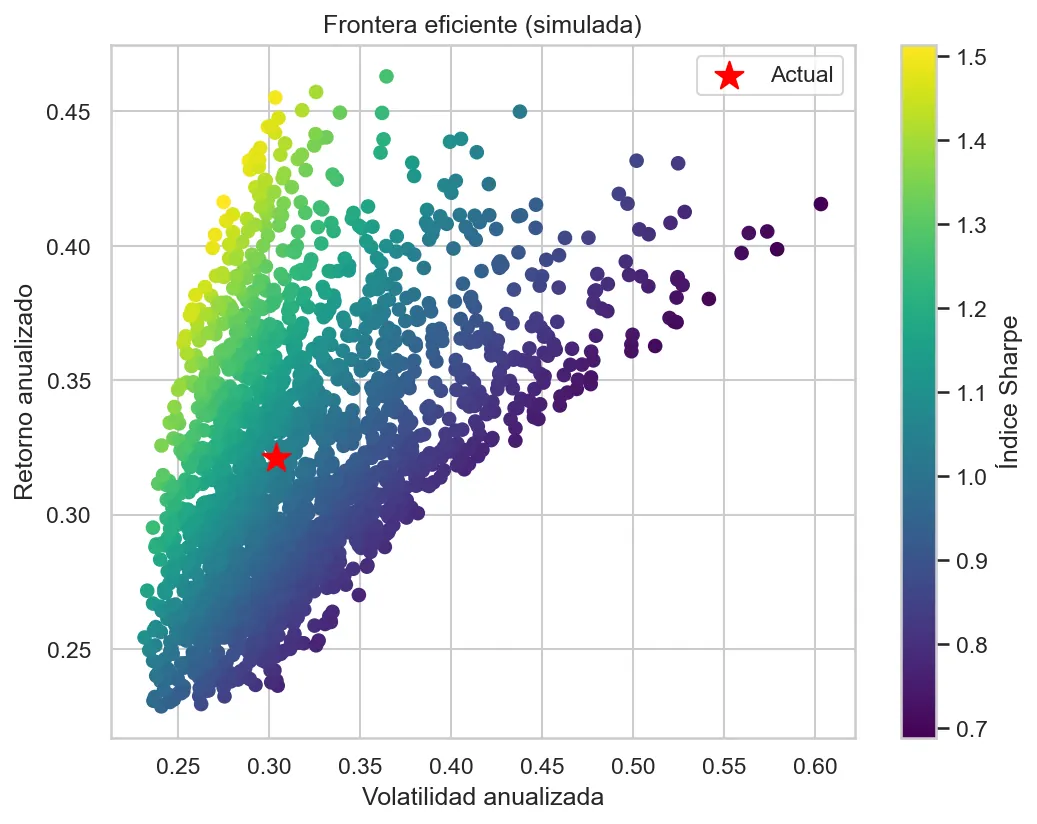
The master's first block: it downloads prices from Yahoo Finance or Alpha Vantage, cleans them into data classes, runs Monte Carlo simulations and writes the reports, shown here on ten hypothetical portfolios.
Getting the data right
The master's first block: a toolkit for market data in five stages. It downloads prices from Yahoo Finance or Alpha Vantage into a standard format; validates and cleans them, checking for gaps, duplicates and impossible prices; and wraps them in data classes for a price series and a portfolio that compute their own statistics.
Simulation and reports
It runs Monte Carlo simulations with geometric Brownian motion, historical bootstrap or stochastic volatility, with VaR and CVaR; and writes Markdown reports with charts. End-to-end tests cover the whole flow, shown here on ten hypothetical portfolios.
Figures