Projects / Master's coursework
Causal graphs
Correlation against causation, by sector
Summary
Learns causal graphs between six US sector ETFs from 2000 to 2024 with PC, Hill Climbing, LiNGAM and Granger tests. The graph changes between calm and crisis periods, and a worked example shows how controlling for the wrong variable distorts the result.
What it does
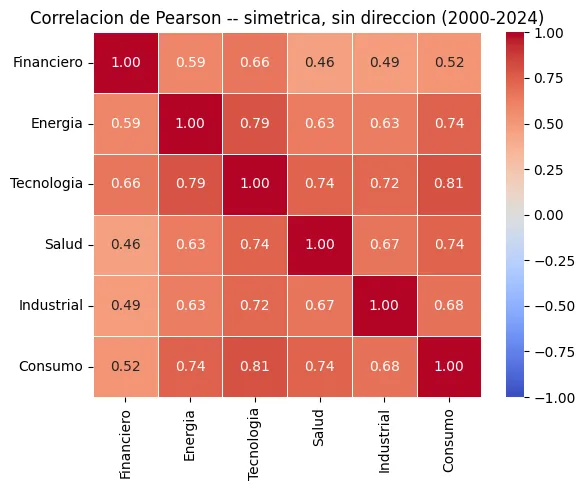
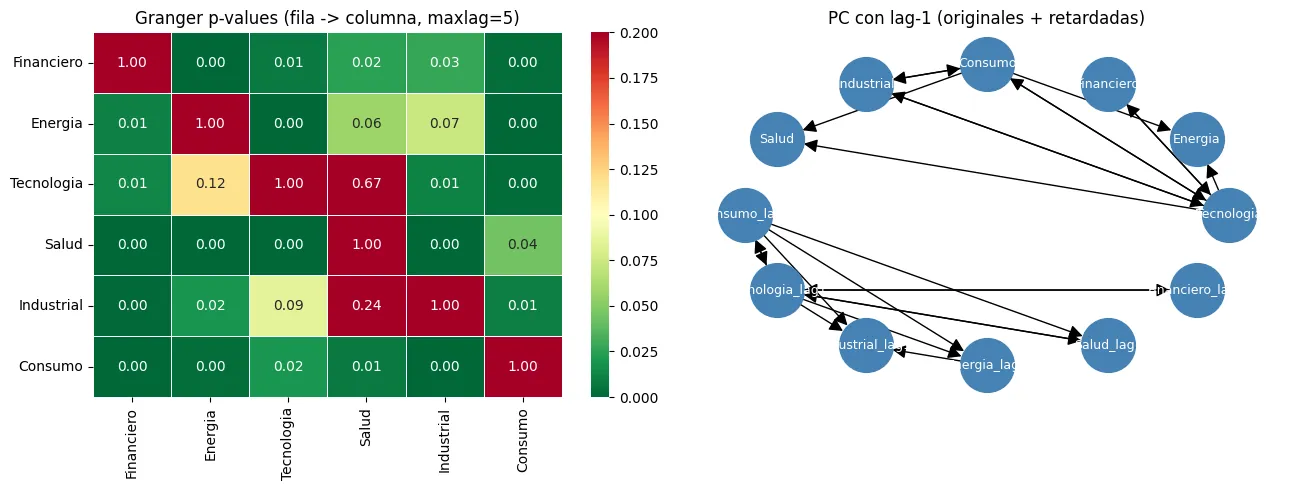
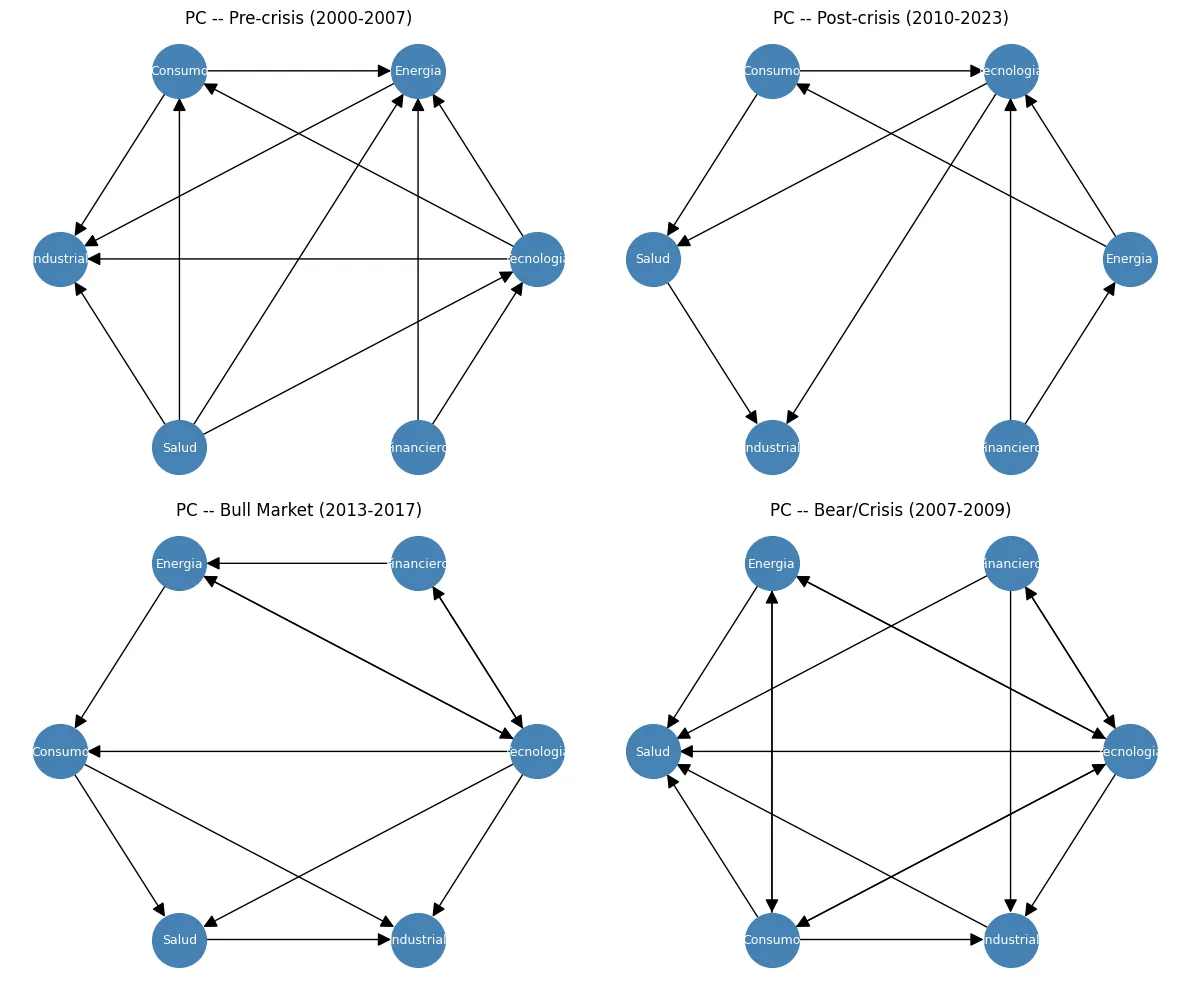
Correlation is symmetric; causation has a direction. Using six US sector ETFs from 2000 to 2024, it learns directed acyclic graphs with the PC algorithm, Hill Climbing and LiNGAM, adds Granger tests for timing, and checks robustness with bootstrap and different significance levels. The graph changes between calm and crisis periods and between bull and bear markets.
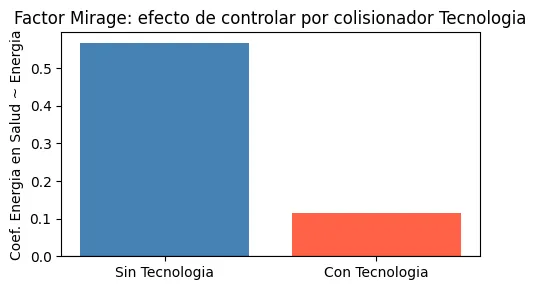
The factor mirage
A worked example shows how controlling for a collider, a variable caused by two others, creates a correlation that isn't there.
Figures