Auguria Studio
Teaching videos built from real data
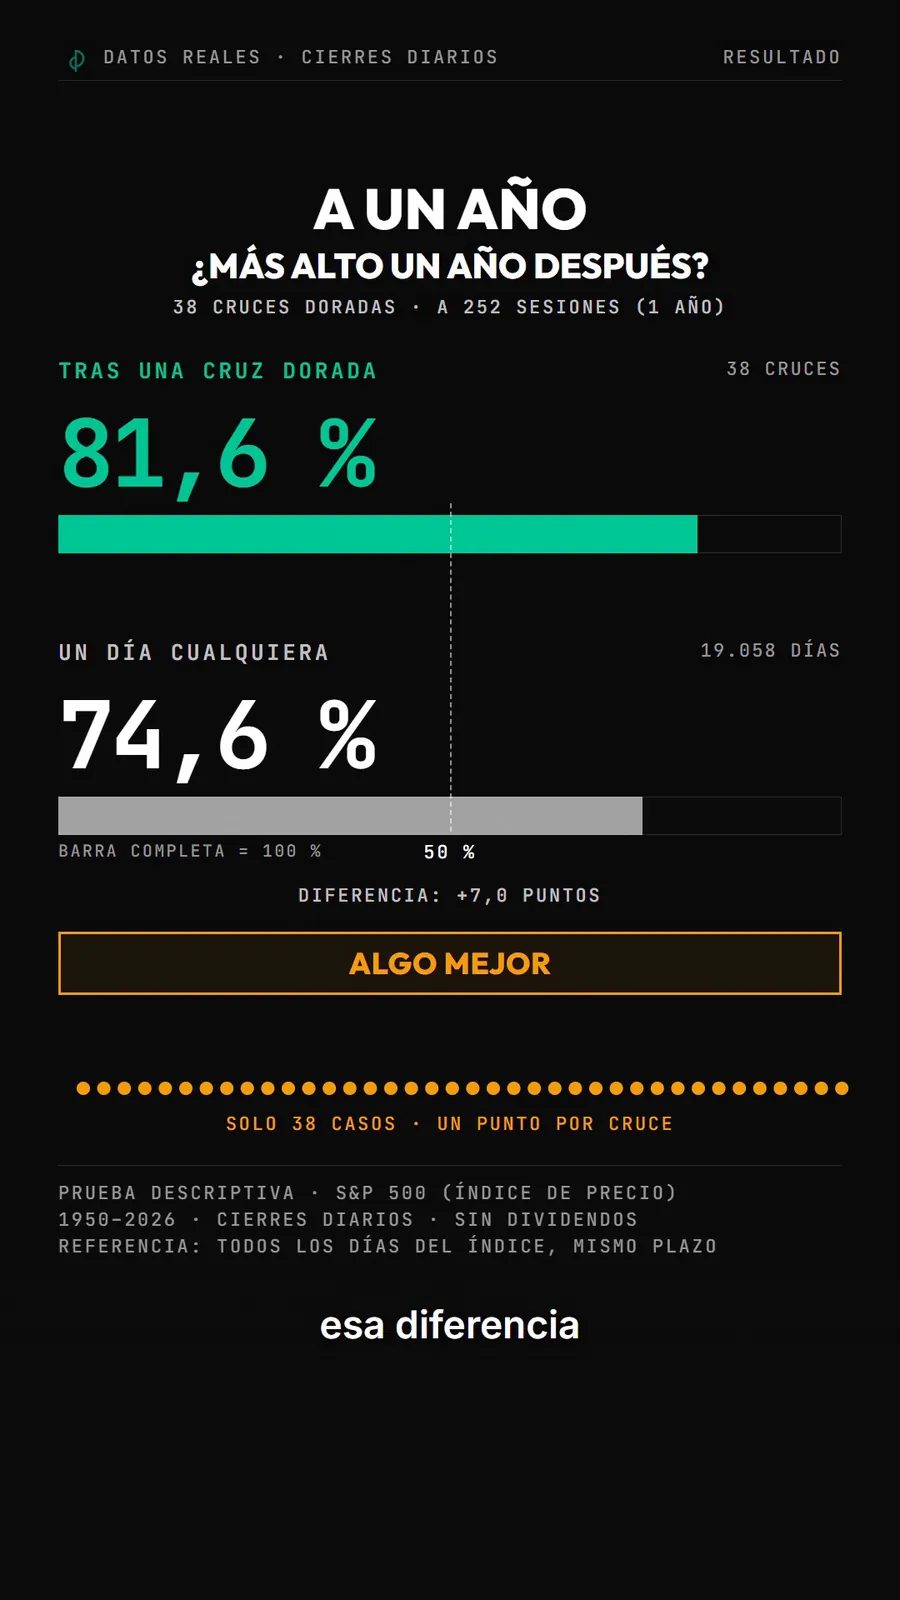
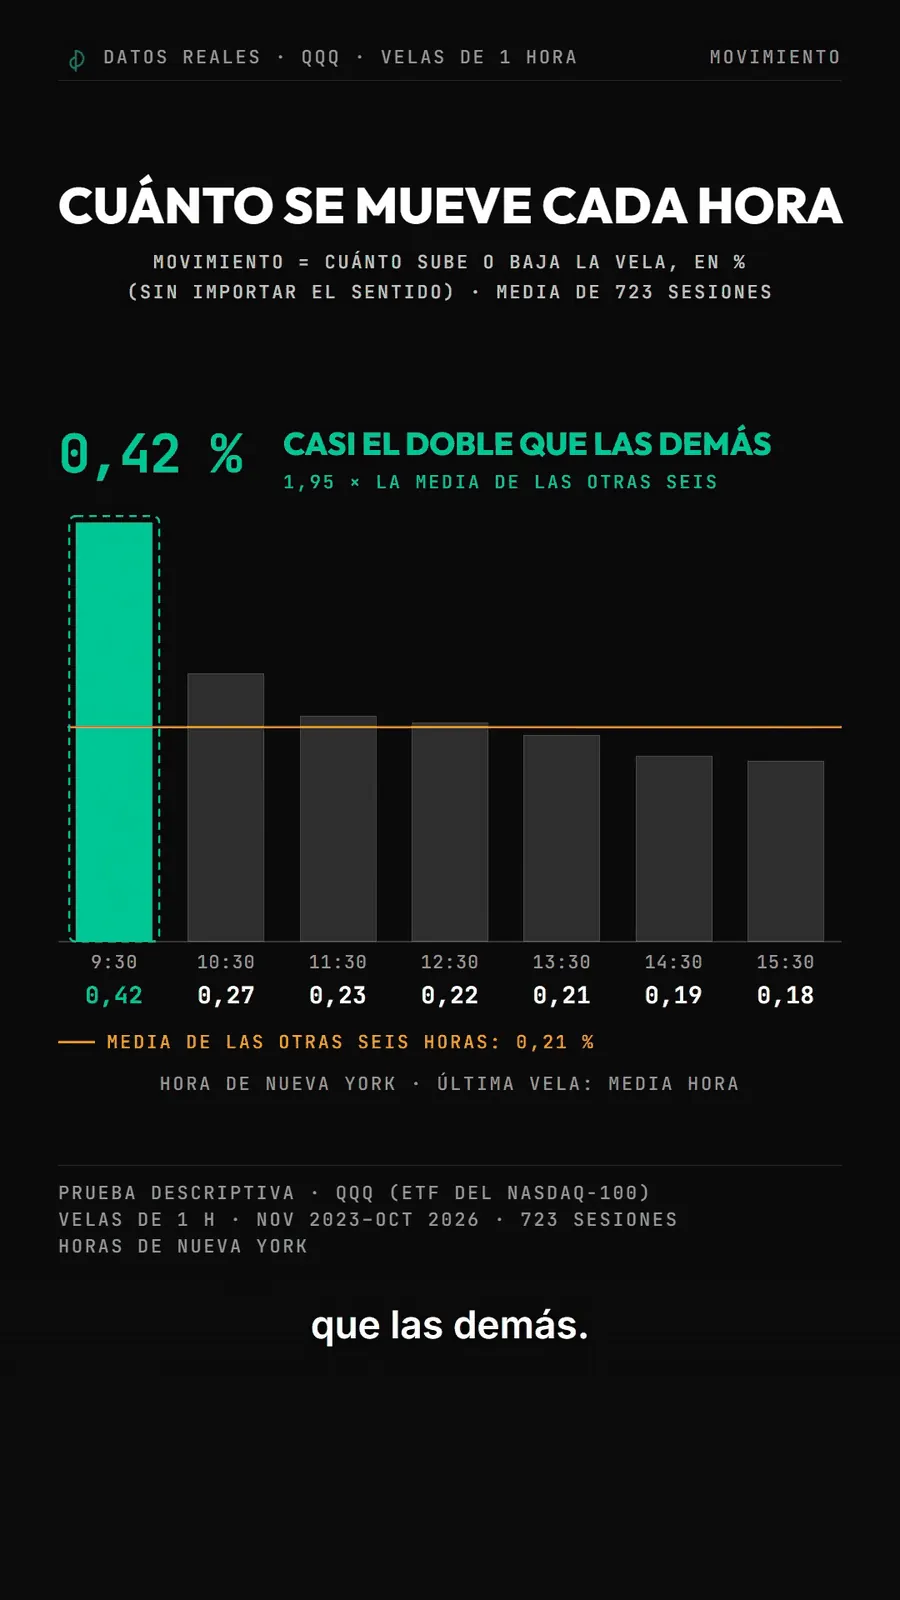
Summary
The studio inside Auguria where agents produce short educational videos and carousels. No figure is typed in by hand: every number on screen is recalculated from the data before it is rendered.
What it is
The studio where Auguria's educational content is made: short vertical videos and carousels styled as technical notes, for TikTok. Three Claude Code agents do the work. One builds videos, one builds carousels, and a separate verifier checks both. So far it has produced 49 videos and 14 carousels.
Each piece is a descriptive test of the past, never advice. Typical questions: what it costs to miss the ten best days, whether September really is the worst month, whether price stops at Fibonacci's 61.8%.
Numbers nobody types by hand
Every study starts with a concrete question that can be proved wrong. A reproducible script computes all the figures into a results file, and the script that builds the video or carousel recalculates them and fails if anything differs. The method is fixed: independent events, a matched reference without the event, a fixed horizon, the number of comparisons stated, and the market, period, sample and limits on screen.
How a piece gets checked
An agent's report is not proof. Before a video is done, ffprobe checks format and duration, silencedetect looks for dead air, frames around every transition are looked at, and the final value of every on-screen counter must match both the data and the voiceover. A search for buy, sell, signal and recommendation wording in every file must come back empty, or each match is listed and justified.
Figures