Market regimes
12 detectors, 60 years of data
Summary
A test bench with no look-ahead leaks, and the first part of my master's thesis. A simple rule won: Mahalanobis turbulence caught 16 of 17 crises. Simple models beat the complex ones.
Walk-forward evaluation with hmmlearn, statsmodels and arch.
The problem
My master's thesis is a multi-agent RAG system that builds portfolios and explains them with citations, and it has to know what state the market is in. Phase 1 builds that piece: a tool that, for any date, returns the regime, its probability and how long it has lasted, using only information published by that date. The earlier attempt had failed for a simple reason: it standardised data over the full sample, which leaks the future.
How it's built
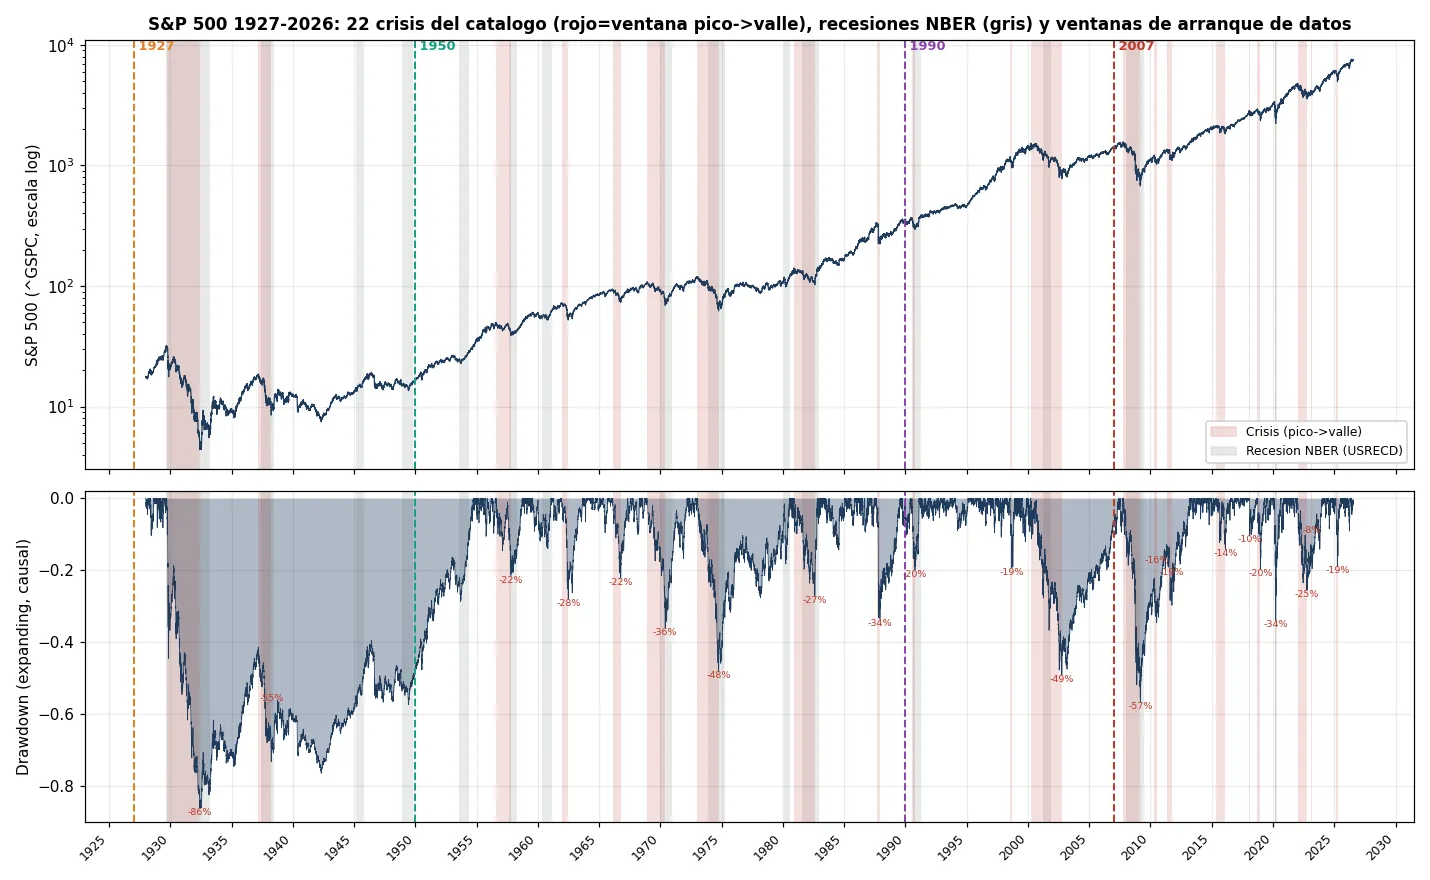
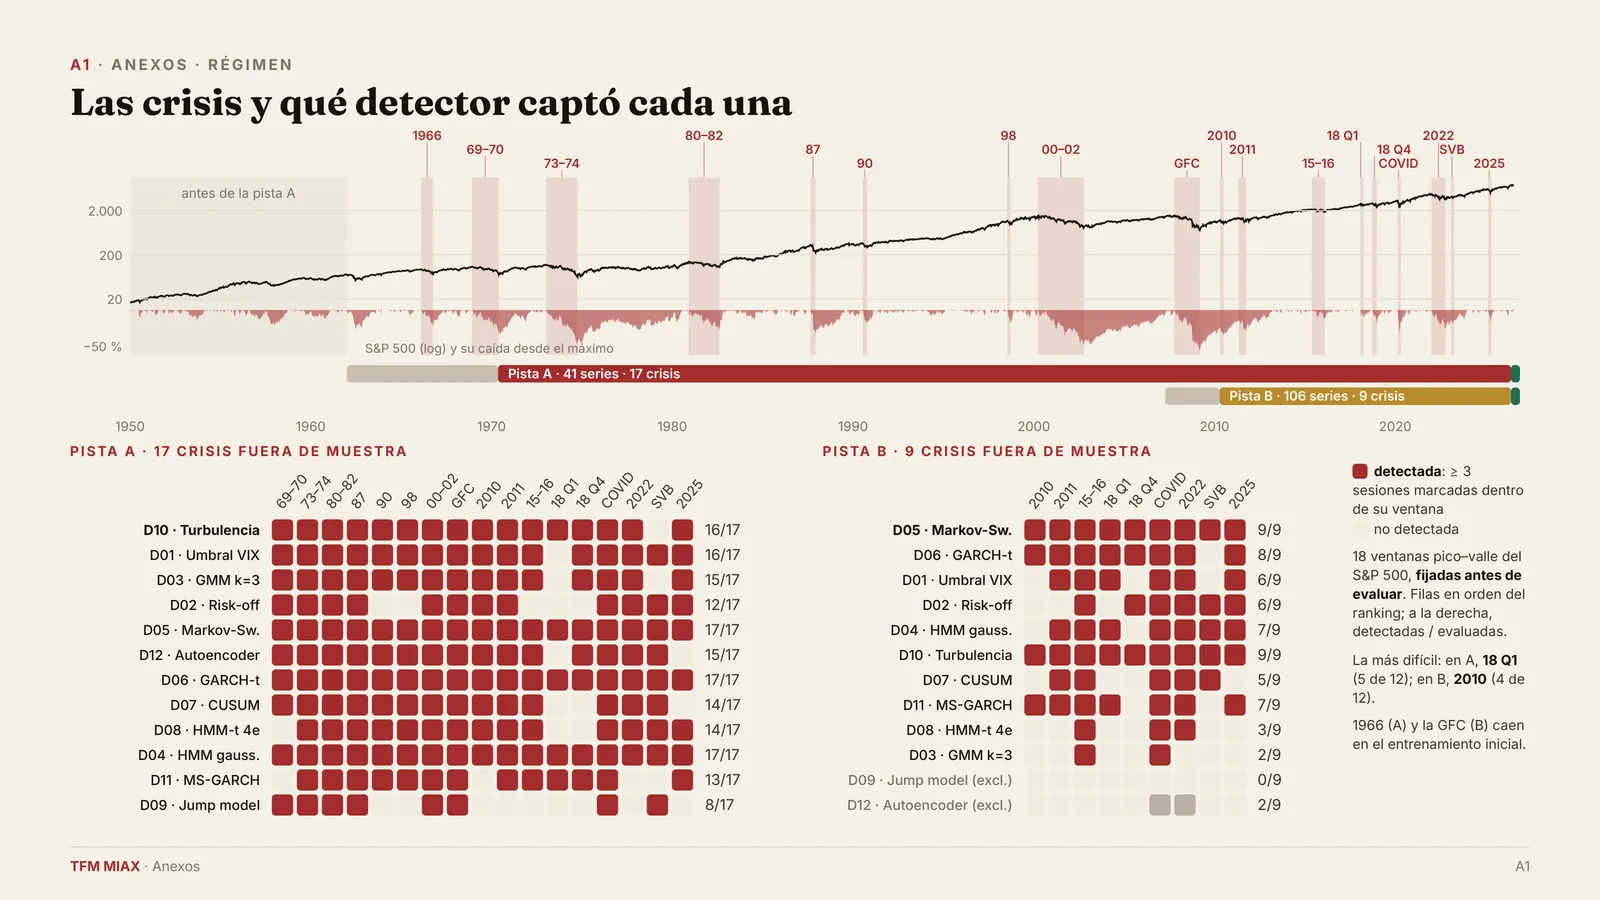
Every feature is causal: z-scores are expanding or rolling, and each series enters with its publication lag. Evaluation is walk-forward, so nothing is judged in-sample, and every detector implements the same interface and is scored by the same judge. There are two frozen data tracks: one from 1962 with 41 features and 18 crises, and a richer one from 2007 with 106 features and 10 crises.
Twelve detectors from seven families compete, from simple rules to hidden Markov models, Markov switching, GARCH, jump models and an autoencoder. A crisis counts as detected when it is flagged for at least three sessions in a row inside its window.
Results
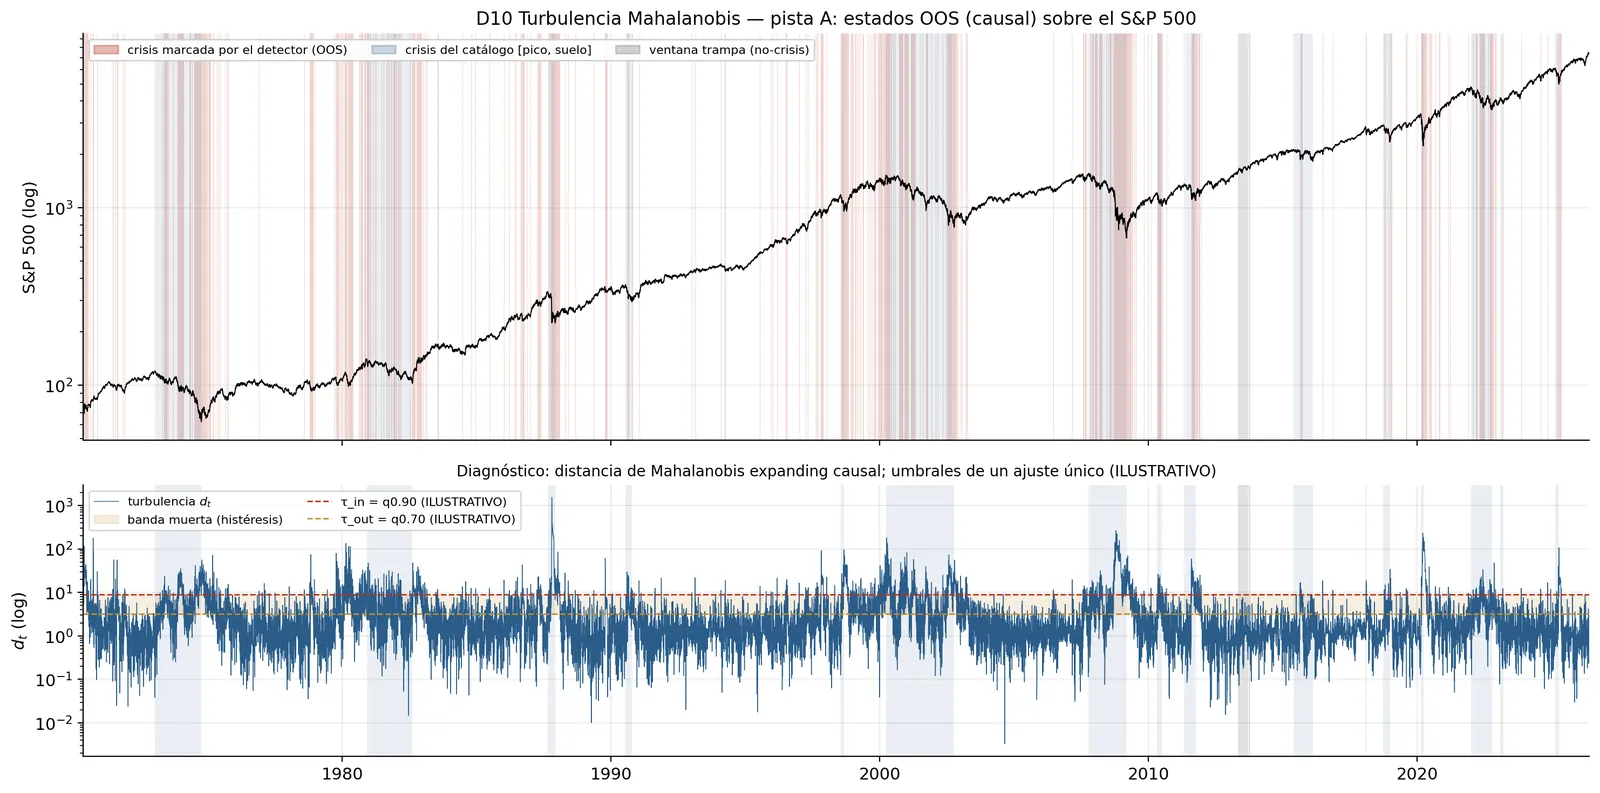
On the long track, a simple rule won: Mahalanobis turbulence caught 16 of 17 crises evaluated out of sample, with 2.35 times the precision of chance. On the rich track, Markov switching came first and caught 9 of 9. The most complex detectors didn't pay off, and two of them didn't even pass the eligibility filter. Combining an alert with a confirmation beat each detector alone, but it did not anticipate the start of a crisis.
Next come the final choice of rule and a pseudo-live test, and Phase 2, the data the agents will read, is already under way.
Figures